
Variation in Teledentistry Regulation by State
Teledentistry is the use of information and communication technology to deliver virtual oral health services in real time (synchronous) or through store-and-forward (asynchronous) methods. Regulatory guidance during the COVID-19 pandemic facilitated the swift adoption and expansion of teledentistry.
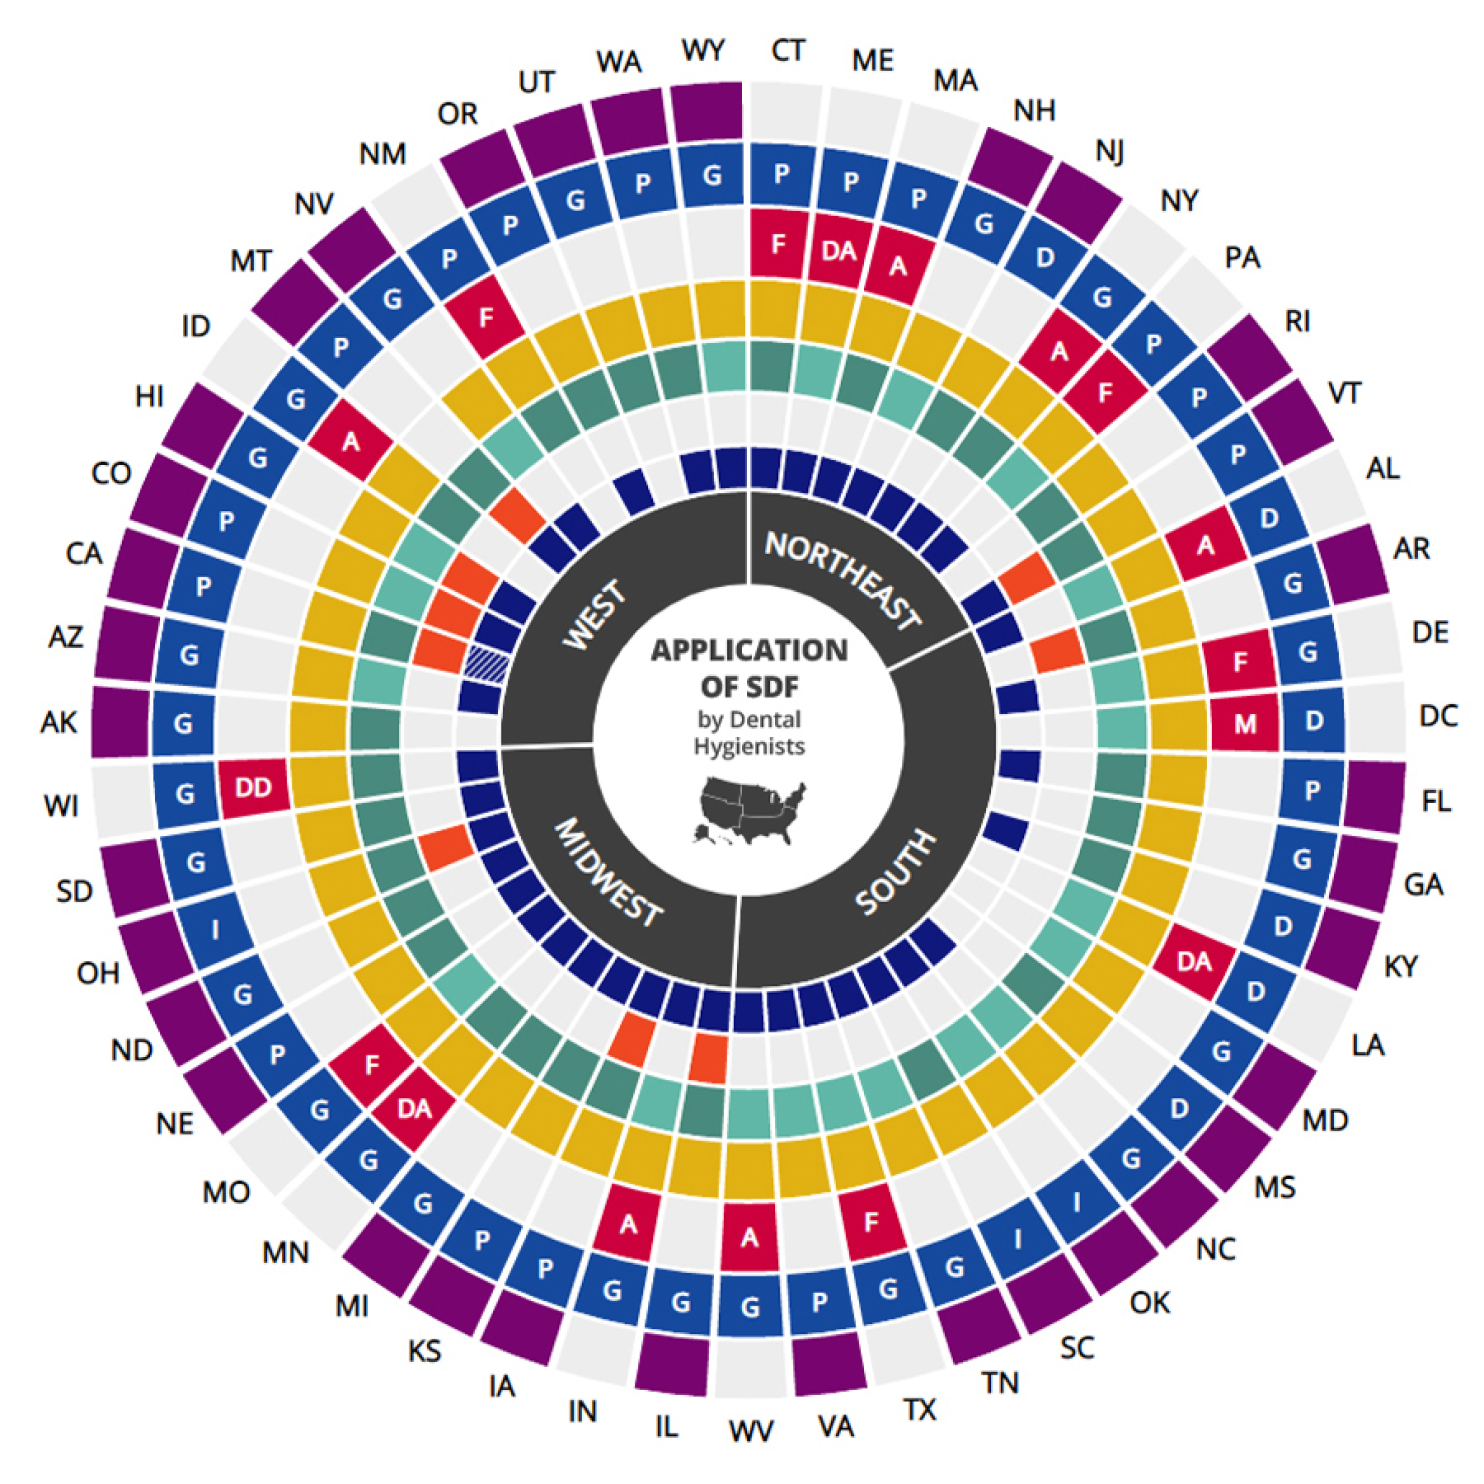
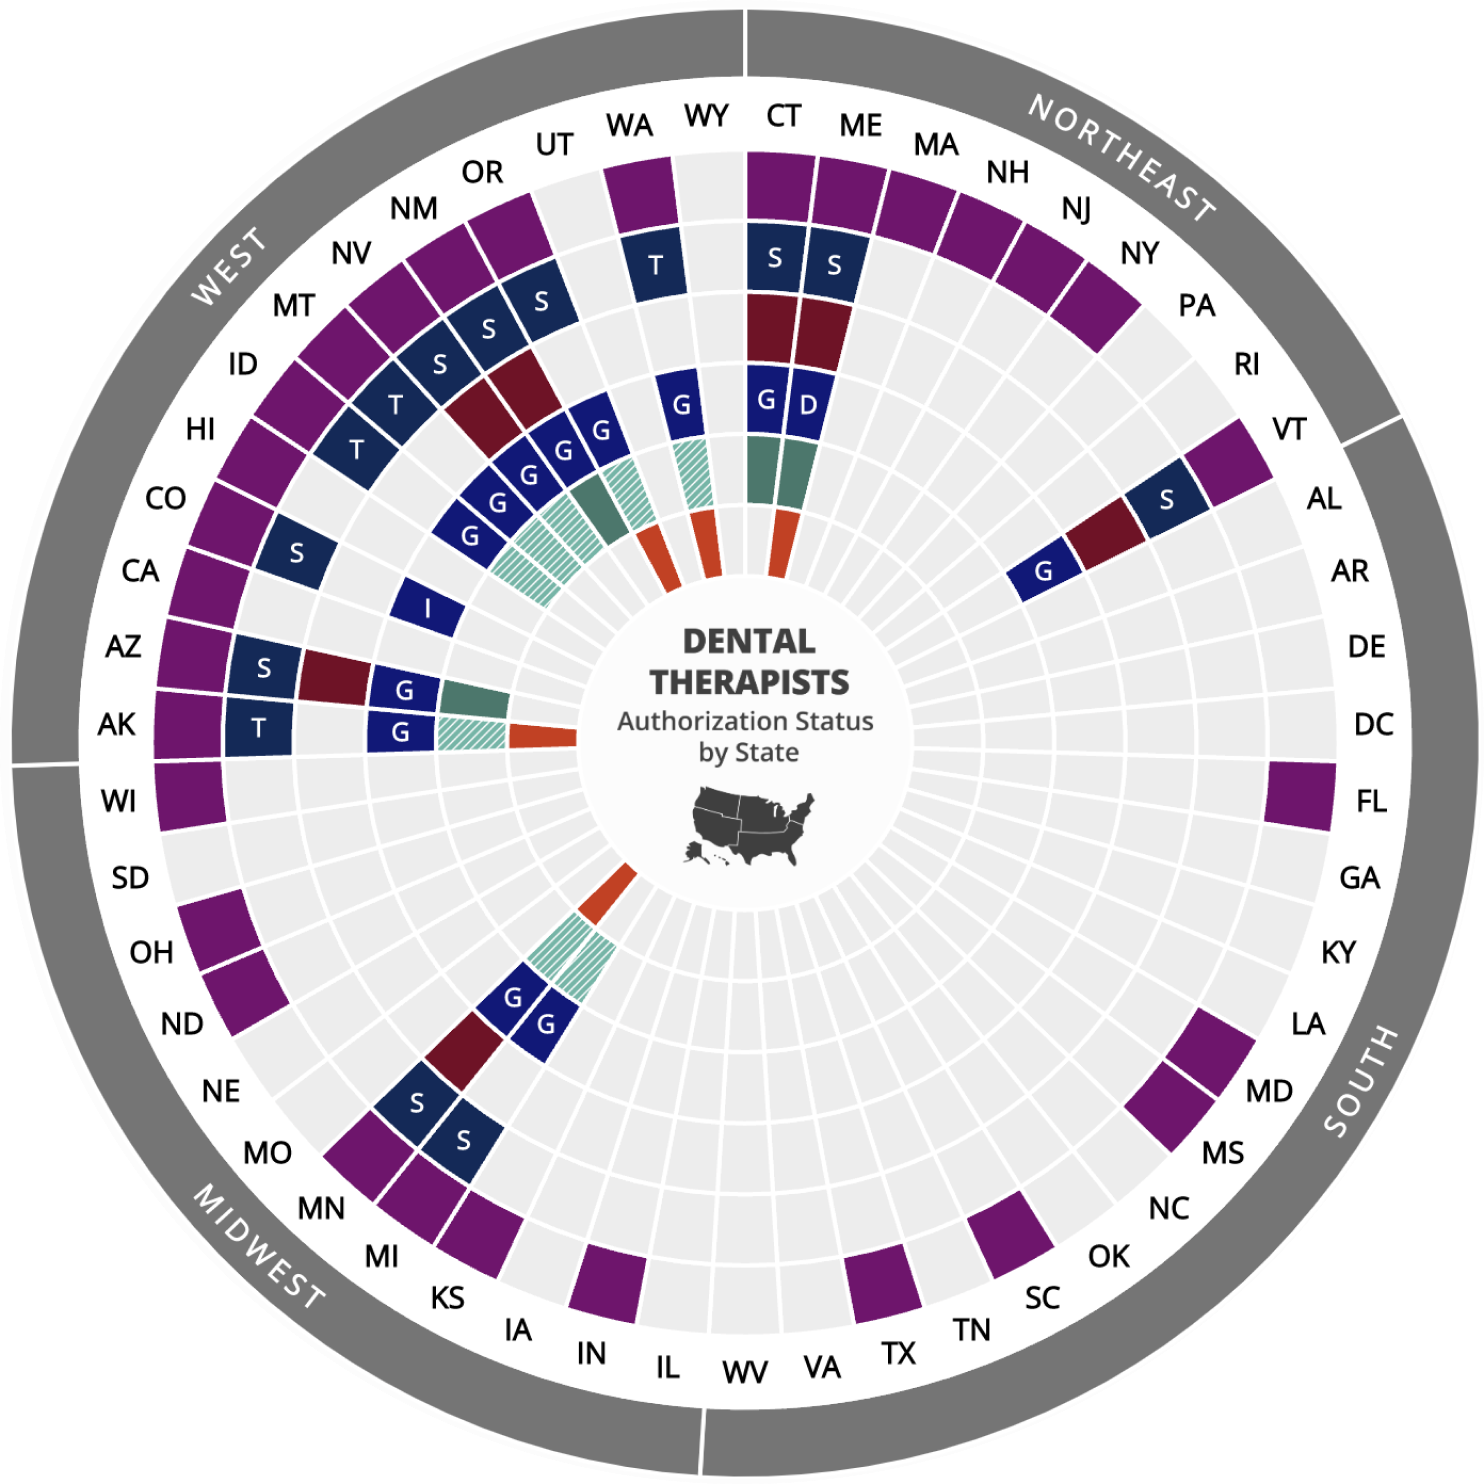
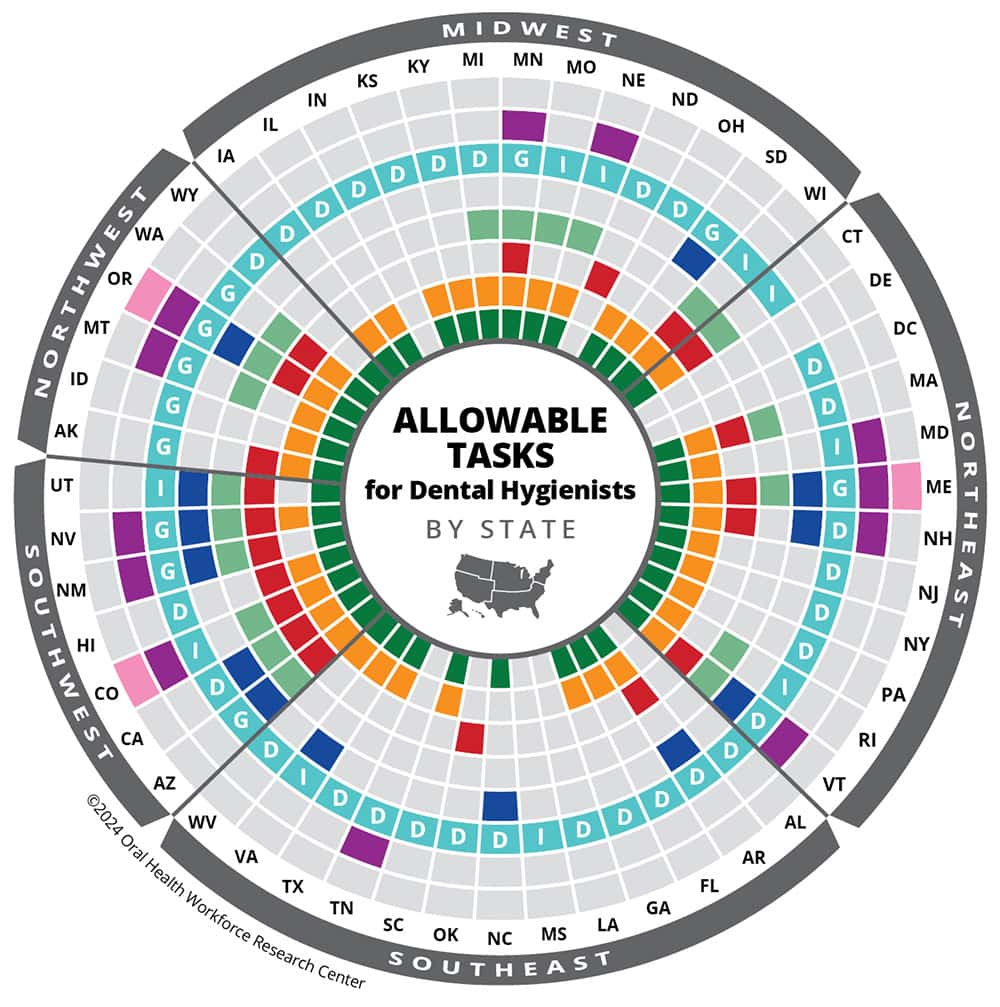
Considerable variability in regulation of teledentistry by states limits the ability of clinicians to provide virtual oral health care. This infographic is designed to help oral health stakeholders understand those differences.
User Guide:
Click on the States, Regions, or on specific tags for more details.

NORTHEAST
TEST, test, test
This infographic is for informational purposes only. For guidance on specific legal or regulatory matters, please contact the appropriate state dental board or a qualified attorney. Due to operational limitations, the most recent regulatory or legislative updates may not be reflected, as the infographic is revised on a 2- to 4-year cycle. If you are aware of newly enacted regulatory or legislative changes, please email us at info@ohwrc.org with supporting documentation. Upon verification, updates will be incorporated to reflect the change/s for the relevant state.
This work is supported by the Health Resources and Services Administration (HRSA) of the US Department of Health and Human Services (HHS) as part of an award totaling $450,000 with 0% financed with non-governmental sources. The information presented in this infographic is based on research conducted by OHWRC and does not necessarily represent the official views of, nor an endorsement by, HRSA, HHS, or the US government. For more information, please visit HRSA.gov.
This infographic is the property of the OHWRC and may not be modified in any way. It may be shared publicly in its current form in its entirety, including the attribution stated above.
Last Updated November 2022.
More Data-Driven Infographics


